
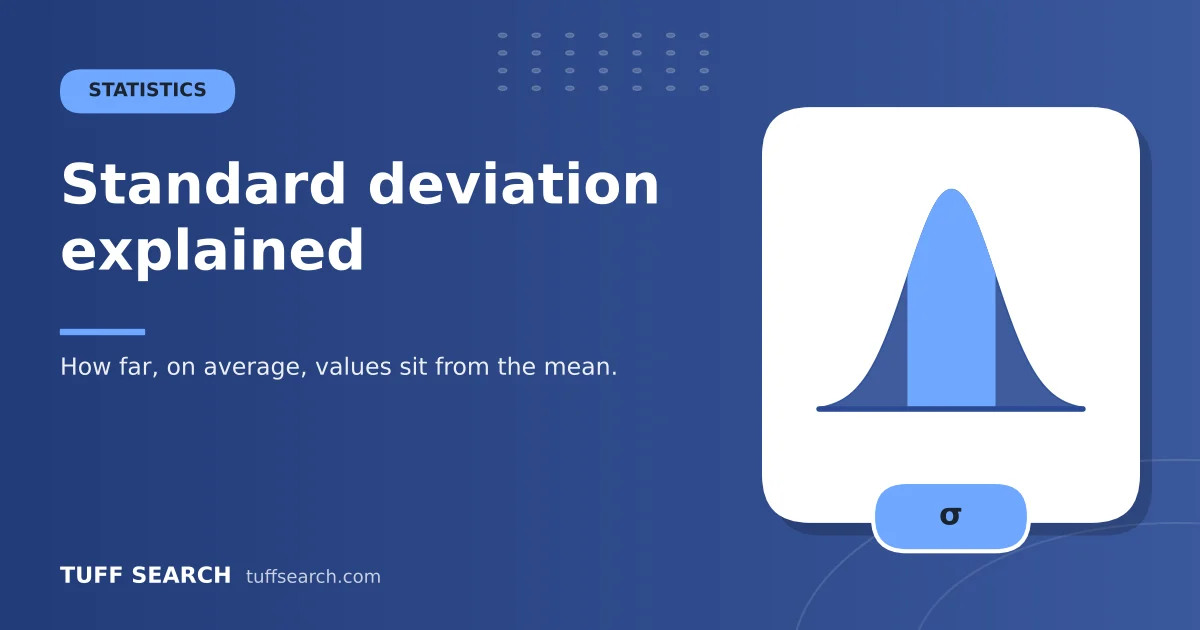
Two classes can have the same average test score but very different results: in one, everyone scores close to the average; in the other, scores are spread from very low to very high. Standard deviation measures that spread. It is one of the most useful numbers in statistics, and it is easier to calculate than it looks.
What standard deviation tells you
- A small standard deviation means values cluster tightly around the mean.
- A large standard deviation means values are widely spread.
- It is in the same units as the data – points, centimetres, dollars – which makes it easy to interpret.
The formulas
Population: σ = √[ Σ(x − μ)² ÷ N ] | Sample: s = √[ Σ(x − x̄)² ÷ (n − 1) ]
Use the population formula when your data includes every member of the group you care about. Use the sample formula – dividing by n − 1 instead of n – when your data is a sample used to estimate a larger population. Dividing by n − 1 (Bessel’s correction) corrects the tendency of a sample to underestimate the spread.
Try it with your numbersNormal Distribution CalculatorFind normal distribution probabilities, z-scores and percentiles: below, above, between or outside values, with…Open calculatorWorked example
Data: 2, 4, 4, 4, 5, 5, 7, 9.
- Find the mean: (2 + 4 + 4 + 4 + 5 + 5 + 7 + 9) ÷ 8 = 40 ÷ 8 = 5.
- Subtract the mean from each value: −3, −1, −1, −1, 0, 0, 2, 4.
- Square each difference: 9, 1, 1, 1, 0, 0, 4, 16.
- Add them: 32.
- Divide: population variance = 32 ÷ 8 = 4; sample variance = 32 ÷ 7 ≈ 4.571.
- Take the square root: population SD = 2; sample SD ≈ 2.138.
Variance is the standard deviation squared. It is used in many formulas, but standard deviation is easier to interpret because it is in the original units.
The 68-95-99.7 rule
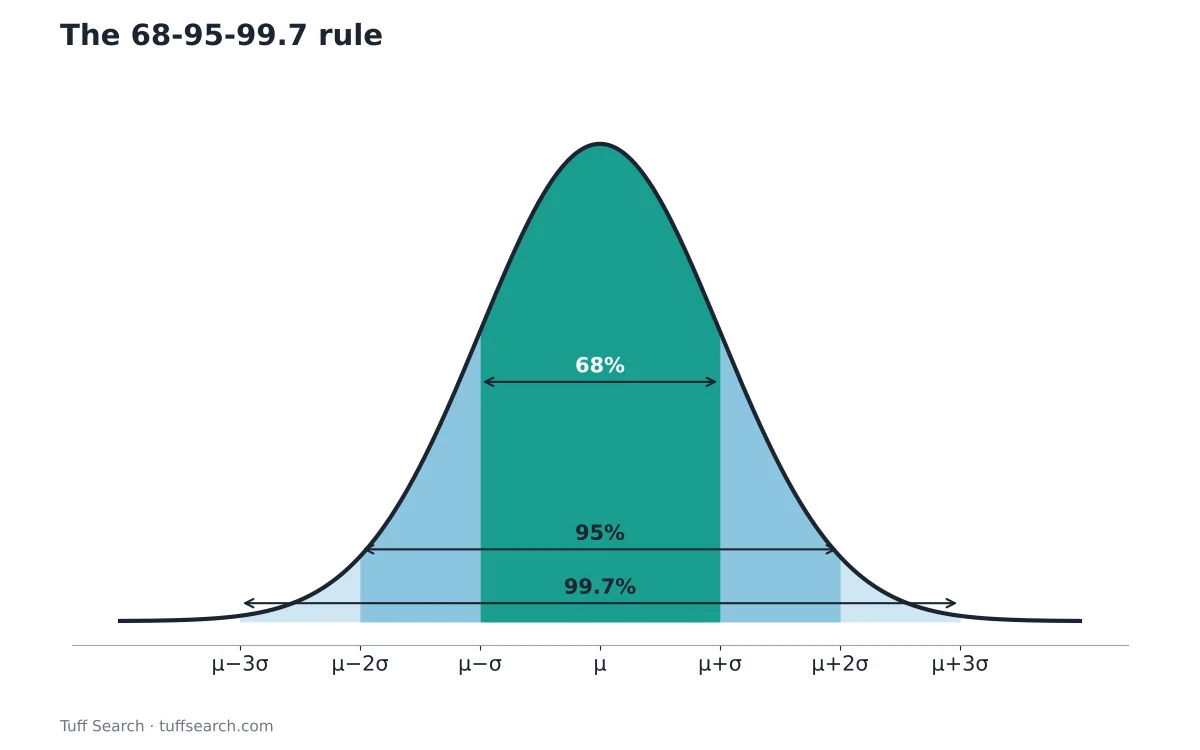
For data that follows a normal (bell-shaped) distribution:
- About 68% of values lie within 1 standard deviation of the mean.
- About 95% lie within 2 standard deviations.
- About 99.7% lie within 3 standard deviations.
Example
exam scores with a mean of 70 and a standard deviation of 10. About 68% of students score between 60 and 80, about 95% between 50 and 90, and almost all between 40 and 100. For exact probabilities between any two values, use the normal distribution calculator.
Z-scores
z = (x − mean) ÷ standard deviation
A z-score tells you how many standard deviations a value is from the mean. A score of 85 in the exam above has z = (85 − 70) ÷ 10 = 1.5 – better than about 93% of students if scores are normal. Z-scores let you compare results from different tests.
Standard deviation in everyday life
- Investing: the standard deviation of returns is a common measure of volatility.
- Manufacturing: quality control keeps product measurements within a set number of standard deviations.
- Weather: average temperature tells you the typical day; standard deviation tells you how changeable it is.
- Games: two dice average 7 with a standard deviation of about 2.42 – the dice average calculator shows the spread for any dice.
Common mistakes
- Using the population formula for a sample (or the reverse).
- Forgetting to square the differences – positive and negative differences would cancel out.
- Forgetting the square root at the end, which gives the variance instead.
- Applying the 68-95-99.7 rule to data that is clearly not bell-shaped.
For the basics of averages, see mean, median and mode.
Frequently asked questions
It is the typical distance of values from the average. Small means values are close together; large means they are spread out.
When your data is a sample used to estimate a larger population. Use n when you have data for the whole population.
For normally distributed data, about 68%, 95% and 99.7% of values fall within one, two and three standard deviations of the mean.
Variance is the average squared distance from the mean; standard deviation is its square root, in the original units.
Related calculators
- Normal Distribution Calculator
- Dice Average Calculator
- Binomial Distribution Calculator
- Percent Error Calculator