

A z-table (standard normal table) tells you the probability that a normally distributed value falls below a given z-score. Reading one takes a minute to learn, and it unlocks percentiles, p-values and confidence intervals. Here is how to use it.
What the numbers in the table mean
Most z-tables show the cumulative area to the left of z under the standard normal curve (mean 0, standard deviation 1). That area is a probability: Φ(z) = P(Z < z). It is also the percentile – a z-score with an area of 0.8944 is at the 89th percentile.
Step by step: looking up z = 1.25
- Split the z-score into the first decimal (1.2) and the second decimal (0.05).
- Find the row for 1.2 down the left side.
- Find the column for 0.05 across the top.
- Where they meet is the area: 0.8944.
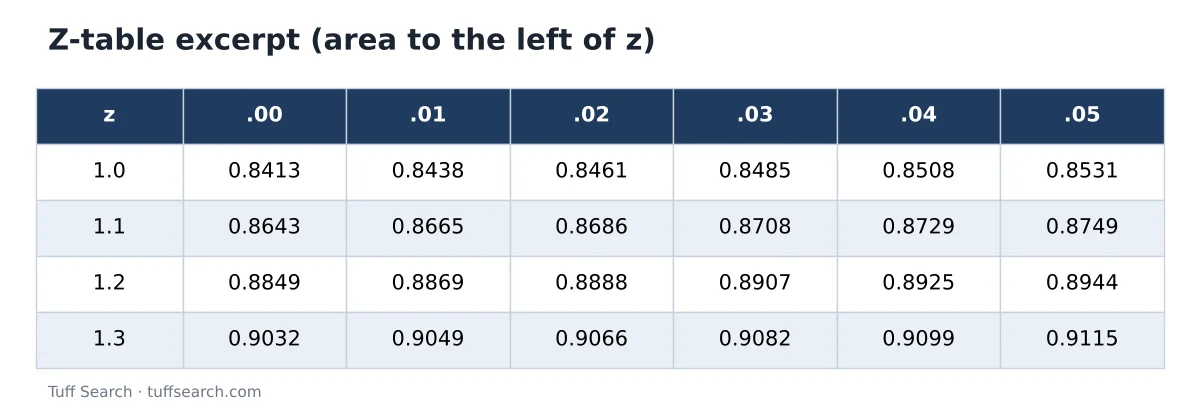
So P(Z < 1.25) = 0.8944: about 89.4% of values are below a z-score of 1.25.
Try it with your numbersZ-Score CalculatorCalculate a z-score from a value, mean and standard deviation, and see its percentile and p-values. Convert percentiles back to z-scores and scores.Open calculatorArea to the right
The total area under the curve is 1, so the area to the right is 1 − the table value. P(Z > 1.25) = 1 − 0.8944 = 0.1056, or about 10.6%.
Area between two z-scores
Subtract the smaller left area from the larger. P(−0.5 < Z < 1.5) = Φ(1.5) − Φ(−0.5) = 0.9332 − 0.3085 = 0.6247. About 62.5% of values fall between those two z-scores.
Negative z-scores
Some tables include negative rows; others only show positive values. Because the curve is symmetrical, Φ(−z) = 1 − Φ(z). For z = −0.84: Φ(0.84) = 0.7995, so Φ(−0.84) = 0.2005 – about the 20th percentile.
Reverse lookup: from a percentile to z
To find the z-score for a percentile, search the body of the table for the area closest to it, then read the row and column. For the 95th percentile, 0.9500 falls between 0.9495 (z = 1.64) and 0.9505 (z = 1.65), so z ≈ 1.645. For the 90th percentile, z ≈ 1.28.
Using it with real data
First convert a value to a z-score: z = (x − mean) ÷ standard deviation. If exam scores have mean 70 and standard deviation 10, a score of 82.5 has z = 1.25, so it beats about 89% of scores. See standard deviation explained for how the standard deviation is calculated, and mean, median and mode for the mean.
Check your table type
- Cumulative (left-tail) tables – the most common – give Φ(z).
- Some tables give the area between 0 and z instead; add 0.5 to convert to a left-tail value for positive z.
- Right-tail tables give 1 − Φ(z). Read the heading or diagram at the top of the table.
Rather than a printed table, the normal distribution calculator works out these probabilities directly for any mean and standard deviation.
Frequently asked questions
Find the row for the z-score’s first decimal and the column for its second decimal; the cell gives the area to the left.
Subtract the table value from 1.
Use the negative rows if the table has them, or calculate 1 minus the value for the positive z-score.
About 1.645.
That 89.44% of values in a standard normal distribution fall below that z-score (here, z = 1.25).
Related calculators
- Normal Distribution Calculator
- Binomial Distribution Calculator
- Dice Probability Calculator
- Relative Risk Calculator
Related articles
- Standard Deviation Explained: What It Means and How to Calculate It
- Mean, Median and Mode: How to Calculate Them and When to Use Each
- Midpoint Formula Explained With Step-by-Step Examples
Sources
- NIST/SEMATECH e-Handbook of Statistical Methods – Measures of scale
- OpenStax Introductory Statistics (Rice University) – free textbook