

The 68-95-99.7 rule – also called the empirical rule or three-sigma rule – is a quick way to understand spread in data that follows a bell-shaped normal distribution. Once you know the mean and standard deviation, it tells you roughly how much of the data lies within one, two and three standard deviations.
The rule
- About 68% of values lie within 1 standard deviation of the mean.
- About 95% lie within 2 standard deviations.
- About 99.7% lie within 3 standard deviations.
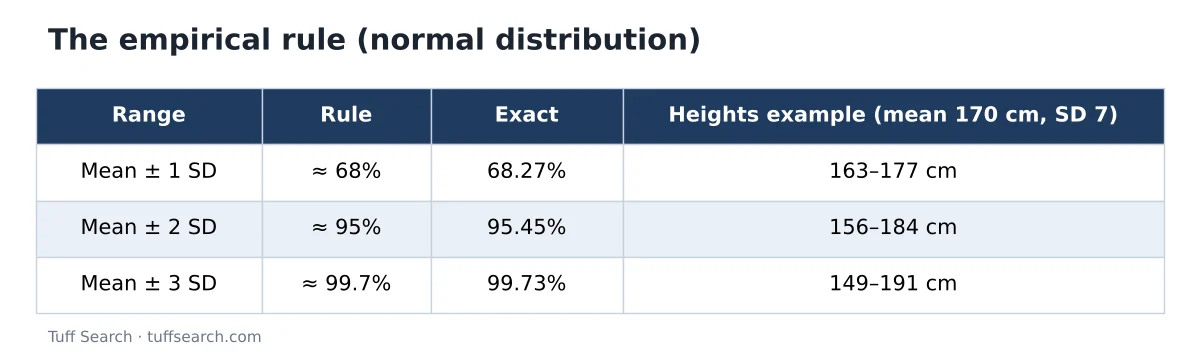
Worked example: adult heights
Suppose adult heights in a group are roughly normal with a mean of 170 cm and a standard deviation of 7 cm. About 68% of people are between 163 and 177 cm, about 95% between 156 and 184 cm, and nearly all (99.7%) between 149 and 191 cm. Someone 191 cm tall is 3 standard deviations above the mean – taller than about 99.9% of the group.
Try it with your numbersStandard Deviation CalculatorCalculate sample or population standard deviation, variance, mean and coefficient of variation, with a step-by-step table and the 68-95-99.7 rule.Open calculatorUsing the rule to find other percentages
Because the curve is symmetrical, you can split the percentages in half. If 68% lie within ±1 SD, then 34% lie between the mean and +1 SD, and 16% lie above +1 SD (half of the remaining 32%). Likewise about 2.5% lie above +2 SD and about 0.15% above +3 SD.
| Question (normal data) | Approximate answer |
|---|---|
| Share above the mean | 50% |
| Share above +1 SD | 16% |
| Share between −1 SD and +2 SD | 34% + 47.5% = 81.5% |
| Share above +2 SD | 2.5% |
| Share below −3 SD | 0.15% |
Spotting unusual values
A value more than 2 standard deviations from the mean happens about 1 time in 20, and one more than 3 standard deviations away about 3 times in 1,000. That is why quality control, lab testing and finance often flag readings beyond 2 or 3 standard deviations for a closer look.
When the rule does not apply
The percentages are only accurate for data that is roughly normal. Skewed data – incomes, house prices, waiting times – does not follow it. For any distribution, Chebyshev’s theorem gives a guaranteed minimum: at least 75% of values lie within 2 standard deviations and at least 88.9% within 3. Check a histogram before relying on the 68-95-99.7 figures.
Related ideas
To find the exact share of data beyond any value, convert it to a z-score and use a z-table – see how to read a z-table. For the spread itself, read standard deviation explained. The normal distribution calculator gives exact probabilities for any mean and standard deviation, and lottery odds explained shows how probability works for discrete events.
Frequently asked questions
In a normal distribution, about 68%, 95% and 99.7% of values fall within 1, 2 and 3 standard deviations of the mean.
It is rounded. The exact values are 68.27%, 95.45% and 99.73%.
About 95% for normally distributed data.
No – only for roughly normal (bell-shaped) data. Chebyshev’s theorem gives minimum percentages for any distribution.
A value more than 3 standard deviations from the mean – about 0.3% of values in a normal distribution.
Related calculators
- Normal Distribution Calculator
- Binomial Distribution Calculator
- Dice Average Calculator
- Permutation Calculator
Related articles
- Standard Deviation Explained: What It Means and How to Calculate It
- Lottery Odds Explained: How Jackpot Odds Are Calculated
- Mean, Median and Mode: How to Calculate Them and When to Use Each