
“Average” can mean three different things in statistics: the mean, the median and the mode. They often give different answers for the same data, and choosing the wrong one can be misleading. Here is how to calculate each and when to use it.
The mean (arithmetic average)
Mean = Sum of all values ÷ Number of values
Test scores of 72, 85, 90, 68 and 85: sum = 400, count = 5, mean = 80.
The mean uses every value, which makes it the standard choice for symmetric data. But it is sensitive to extreme values (outliers).
The median (middle value)
- Sort the values from smallest to largest.
- If there is an odd number of values, the median is the middle one.
- If there is an even number, it is the mean of the two middle values.
Sorted scores: 68, 72, 85, 85, 90 → median 85. For 68, 72, 85, 90 (four values), the median is (72 + 85) ÷ 2 = 78.5.
Try it with your numbersDice Average CalculatorFind the average roll for any dice formula such as 3d6+2, with minimum, maximum, spread and advantage – explained with…Open calculatorThe mode (most common value)
The mode is the value that appears most often. In the scores above, 85 appears twice, so the mode is 85. Data can have no mode, one mode, or several. The mode is the only average that works for categories, such as the most common shoe size or favourite colour.
Why the mean can mislead
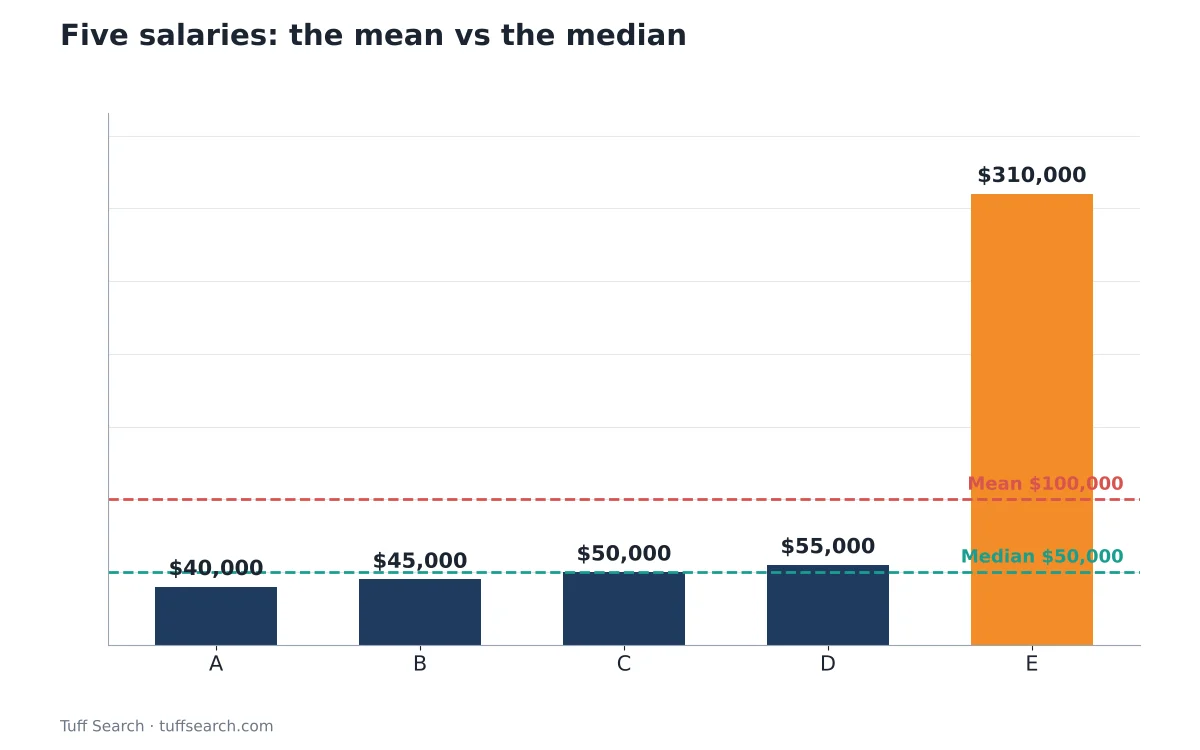
Five people earn $40,000, $45,000, $50,000, $55,000 and $310,000. The mean is $500,000 ÷ 5 = $100,000 – yet four of the five earn less than $56,000. The median, $50,000, describes a typical person much better. That is why house prices and incomes are usually reported as medians.
Which average should you use?
| Situation | Best average | Why |
|---|---|---|
| Symmetric data with no extreme values | Mean | Uses all the data |
| Skewed data – incomes, house prices, waiting times | Median | Not pulled by outliers |
| Categories – sizes, colours, brands | Mode | Only average that works for non-numbers |
| Most likely single result | Mode | The value that occurs most |
Shape of the data
- Symmetric data (such as a normal distribution): mean, median and mode are equal or very close.
- Right-skewed data (a long tail of high values): mean > median.
- Left-skewed data (a long tail of low values): mean < median.
The total of two six-sided dice is a neat symmetric example: the mean, median and mode are all 7. The dice average calculator works out the mean for any dice notation, and the normal distribution calculator covers the classic bell curve.
Weighted average
When some values count more than others, use a weighted mean:
Weighted mean = Σ(value × weight) ÷ Σ(weights)
A course grade with homework 85 (weight 20%), midterm 78 (30%) and final exam 90 (50%): (85 × 0.2) + (78 × 0.3) + (90 × 0.5) = 17 + 23.4 + 45 = 85.4. Grade point averages work the same way, weighted by credit hours.
Other measures worth knowing
- Range = largest − smallest value – a quick measure of spread.
- Standard deviation – how far values typically sit from the mean. See standard deviation explained.
- Geometric mean – used for growth rates, such as average investment returns.
Frequently asked questions
The mean is the sum divided by the count; the median is the middle value when sorted; the mode is the most frequent value.
When data is skewed or has outliers, such as incomes or house prices, because the median is not pulled by extreme values.
Sort the values and take the mean of the two middle ones.
Multiply each value by its weight, add the results and divide by the sum of the weights.
Related calculators
Related articles
- Standard Deviation Explained: Formula and Example
- Midpoint Formula Explained With Step-by-Step Examples
- Drop Chance Explained: Why 1% Doesn’t Mean 100 Tries