What Is Drop Chance And Why Does It Matter?
Drop chance is the probability that a specific item will appear after a single in-game attempt. Game developers assign every loot item a drop rate, often expressed as 1 in X. For example, a 1 in 100 drop rate means each attempt gives you a 1% individual chance.
However, individual chance is misleading. After 100 attempts at a 1% drop rate, your cumulative chance is only about 63.4% — not 100%. This is where most players go wrong. They assume guaranteed results when the math says something different.
Understanding the difference between a drop rate and cumulative drop chance changes how you plan your grind. Furthermore, it helps you recognize when you’re simply unlucky versus when something is wrong.
The Math Behind Drop Chance
Drop Chance Formula
The core formula for cumulative drop chance uses binomial probability. Specifically, it calculates the probability of getting at least one drop over multiple attempts. The formula is:
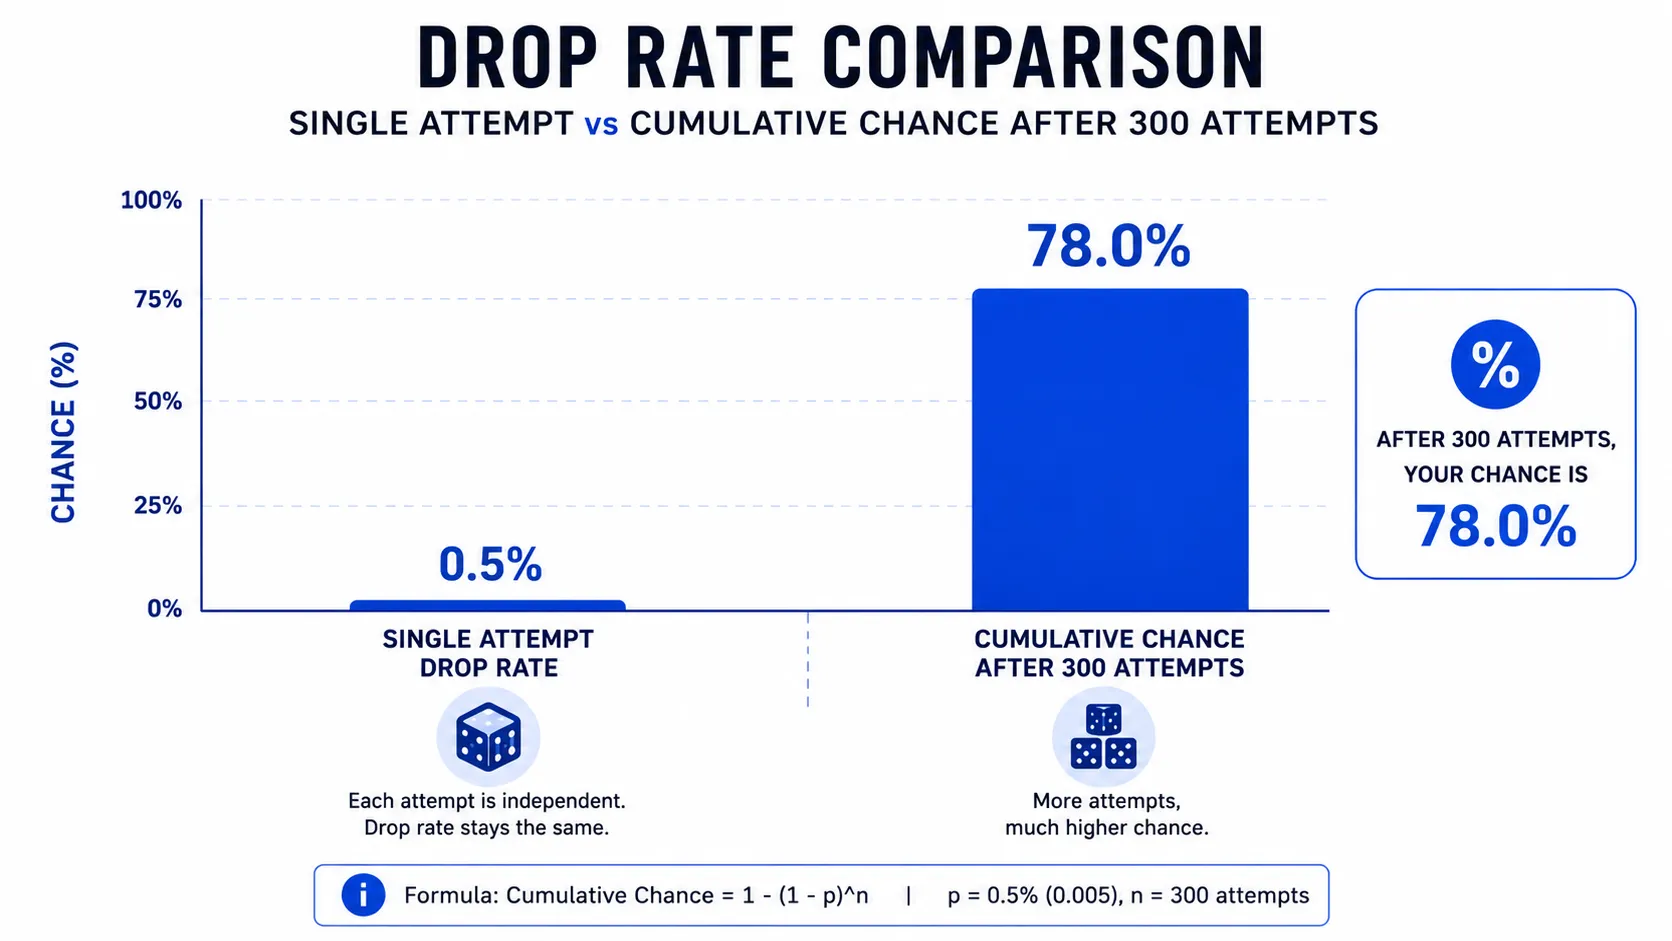
Cumulative Chance = 1 − (1 − p)^n
Here, p is the individual drop rate per attempt (expressed as a decimal), and n is your total number of attempts. So for a 1 in 200 drop rate over 300 kills, the result is: 1 − (1 − 0.005)^300 = ~78%. This drop chance formula applies to every game that uses a loot table driven by RNG.
Drop Rate vs Drop Chance Key Difference
Think of a coin flip. Each flip carries a fixed 50% chance, no matter what happened before it. But across 10 flips, your chance of landing at least one heads climbs to 99.9%.
That is the difference a drop rate calculator reveals. Your drop rate never changes, but your cumulative drop chance keeps growing with every attempt you log.
Players who confuse the two end up convinced the game owes them something it never promised. That belief fuels most of the rage in grind communities.
How Many Kills Do You Actually Need?
Attempts Needed for a Target Probability
Instead of asking your odds per kill, flip the question. Ask how many kills to get a drop at a confidence level you can plan around.
At a 1 in 500 drop rate, reaching 90% confidence takes 1,151 kills. Knowing that number upfront turns a vague grind into a realistic session goal you can track.
You can plan your week around that number. No more grinding blind and hoping today is the lucky day.
What Is a 1 in 5,000 Drop Chance as a Percentage?
What is 1 in 5000 drop chance percentage? It equals 0.02% per attempt. After 5,000 attempts, your cumulative chance only reaches about 63.2%, and reaching 95% confidence requires roughly 14,979 kills.
This is exactly why ultra-rare drops feel so brutal. The math, not bad luck, is working against you at that scale, and no amount of streaming superstition changes it.
How to Use a Dry Streak Calculator
A dry streak is simply going N attempts in a row without a single drop. It happens to everyone, even at decent drop rates. It does not mean your game is rigged against you.
Yet it still feels personal every single time it happens to you.
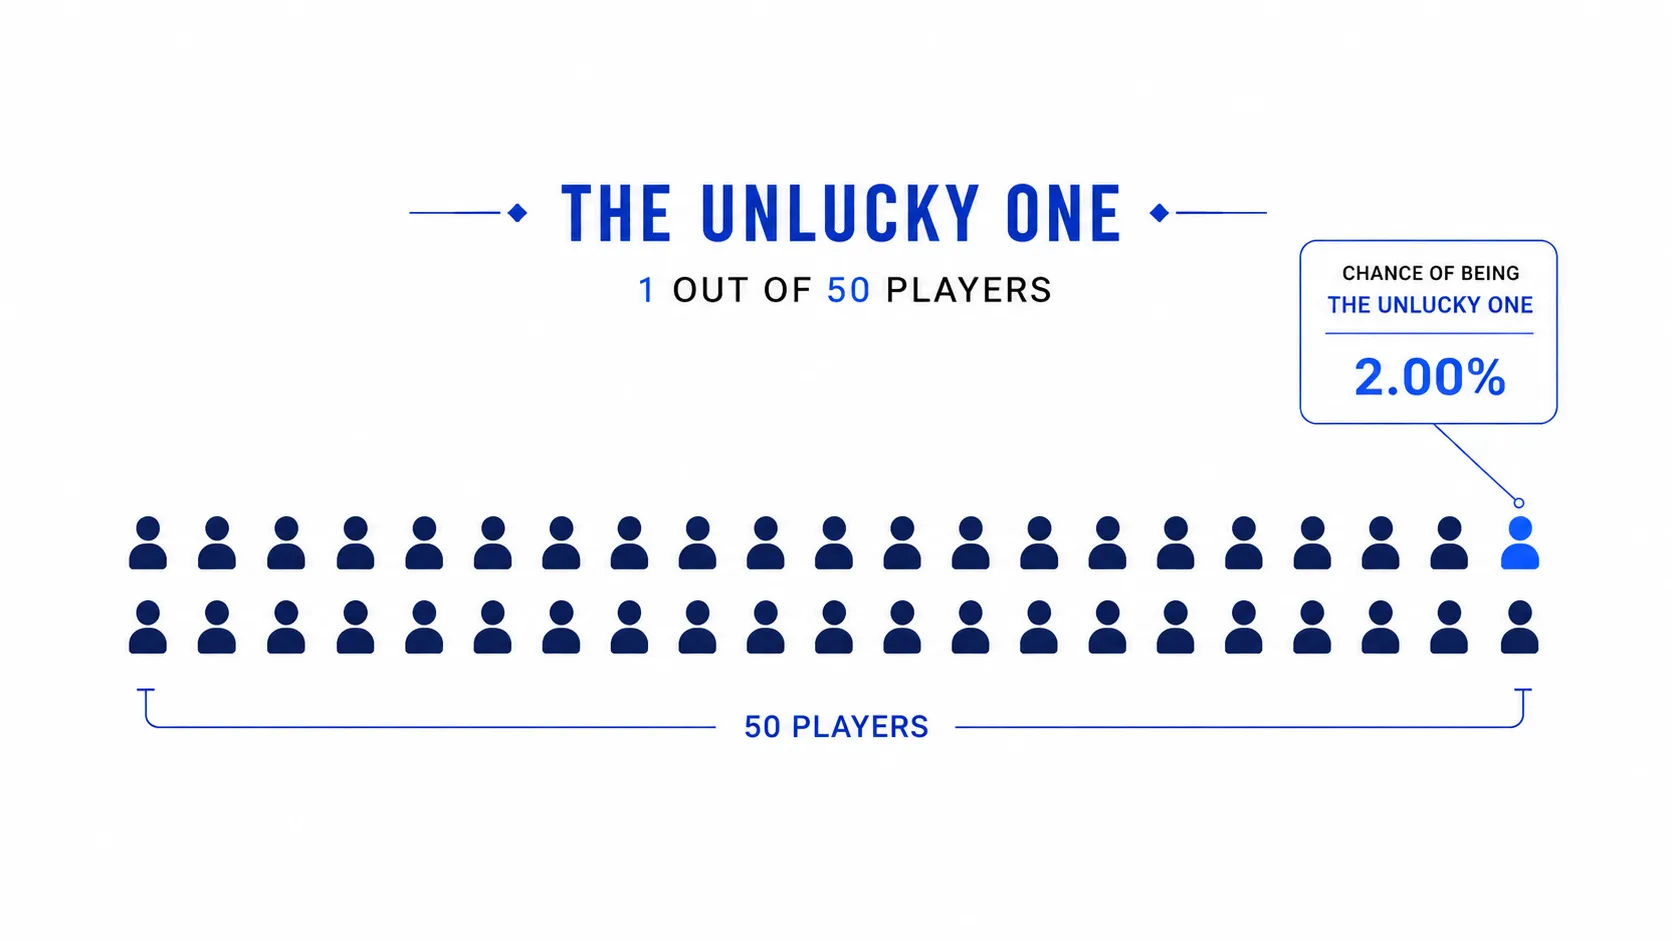
The formula here is (1 − p)^n, the flip side of the cumulative chance formula. At a 1 in 128 drop rate over 500 kills, you still face roughly a 2.1% chance of going dry.
Put differently, roughly 1 in 50 players at that rate will grind past 500 kills and find nothing. A dry streak calculator turns that bad-luck feeling into a real, bounded number.
That number matters. It tells you when a streak is statistically normal, and when something else might actually be wrong.
Game-Specific Uses OSRS Drop Rate and Beyond
Drop chance math is not theoretical. Different games, communities, and economies run on it daily, and OSRS leads the pack in tracking it seriously.
Reddit threads and Discord servers track these rates obsessively, swapping kill counts like trading cards. Most of that discussion still comes down to the same cumulative formula.
Old School RuneScape players know drop rate math better than almost any other gaming community. The Twisted Bow drops at 1 in 1,500 from Chambers of Xeric, a chase most players spend months on. An osrs drop rate calculator turns that rate into a real kill-count target.
The same math applies far beyond OSRS. Minecraft enchanted book trades, Path of Exile unique drops, and Diablo 4 uber-uniques all run on it. So does rare loot in Escape from Tarkov.
Even outside gaming, the logic holds. Trading card pulls and loyalty reward systems use the same loot table math. Wherever RNG drives a loot table, binomial probability is quietly running the odds behind every single pull.
Frequently Asked Questions
Have questions or feedback about this calculator? Feel free to Contact Us — we’re always looking to improve your experience.
Why Use Tuff Search Drop Chance Calculator?
This loot drop calculator goes further than a basic percentage tool, and here is exactly why.
- All-in-one results: See cumulative probability, attempts needed, dry streak odds, and expected drops in a single calculation, side by side.
- No friction: No sign-up, no downloads, and no ads standing between you and your real odds.
- Flexible input: Enter your drop rate as 1 in X, a percentage, or a decimal your choice.
- Universal coverage: This drop chance calculator works for OSRS, Diablo 4, Path of Exile, Minecraft, and every other loot based game.
That is real loot odds, calculated instantly, with zero guesswork standing between you and your next grind session. No other free tool puts all four numbers in one place, ready whenever you need them.
Ready to Beat the RNG? Calculate Your Odds Now
Stop guessing. Enter your drop rate and kill count into the Tuff Search drop chance calculator right now.
Get your real cumulative odds, your dry streak risk, and your attempts-needed target in seconds. Start your next grind knowing exactly what you are up against.